
Cyber risk benchmarking is the systematic process of measuring an organization's cybersecurity posture against industry peers, established frameworks, and internal baselines. It reveals where defenses stand and which gaps cyberattackers are most likely to exploit.
This guide covers the three benchmarking categories every security leader needs: standards-based, peer comparison, and internal trend tracking. It also explains the frameworks that power them, including NIST CSF 2.0, CIS Controls, and FAIR (Factor Analysis of Information Risk) for financial quantification.
The guide provides a step-by-step process for conducting a benchmarking program, selecting the metrics that matter, and translating technical results into board-ready business cases. It also addresses benchmarking for specialized environments such as third-party risk, operational technology and industrial control systems (OT/ICS), and multi-cloud deployments.
Organizations that benchmark effectively see measurable results, turning cyber risk benchmarking from a periodic reporting exercise into a continuous engine for risk reduction, budget justification, and board-level confidence.
What Is Cyber Risk Benchmarking and Why It Matters
Cyber risk benchmarking measures an organization's cybersecurity performance, controls, and risk posture against internal baselines, industry peers, or established standards on an ongoing basis. Unlike point-in-time evaluations, it provides continuous comparison data showing whether security investments are closing gaps or merely maintaining the status quo.
It translates cybersecurity from an opaque cost center into a quantifiable business function that boards, regulators, and insurers can evaluate with the same rigor applied to financial performance.

How Cyber Risk Benchmarking Differs from Maturity Assessments
Maturity assessments and cyber risk benchmarking serve different purposes, and conflating them leads organizations to mistake a snapshot for a trend line. A maturity assessment evaluates an organization's capabilities against a defined framework, such as NIST CSF or CMMC, at a single point in time, producing a level rating.
Benchmarking, by contrast, is an ongoing measurement discipline that tracks performance over months and years, revealing whether the organization is improving, stagnating, or regressing relative to peers.
The distinction matters because cyber threat velocity has rendered annual assessments insufficient. An organization that scores "managed" on a maturity framework in January may be dangerously exposed by June if its phishing simulation click rate rises while competitors drive theirs down. Benchmarking catches that drift, answering not just where an organization stands now but whether it is improving and at what rate.
The gap between measuring maturity once and benchmarking it continuously is the gap between knowing a rating and knowing whether risk is actually declining.
The Four Phases of Cyber Risk Benchmarking Maturity
Organizations typically progress through four distinct phases as their cyber risk benchmarking capability matures: Nascent, Developing, Established, and Leading. The journey moves from fragmented, reactive security measurement to proactive, culturally embedded risk quantification.
- Nascent organizations operate with ad hoc controls, minimal documentation, and no consistent measurement of risk; security decisions remain reactive, addressing issues only after they surface;
- Developing-phase organizations introduce formalized policies and initial benchmarking efforts, though measurement stays inconsistent and leadership engagement remains sporadic;
- Established-stage organizations run continuous benchmarking programs with clear metrics, executive dashboards, and defined risk appetites, tying security spending decisions directly to measured control effectiveness;
- Leading-phase organizations integrate cyber risk benchmarking into strategic planning, link security metrics to enterprise risk management, insurance underwriting, and M&A due diligence, and benchmark across sectors to anticipate cyber threats before they materialize.
Why Cyber Risk Benchmarking Matters: From Cost Center to Business Metric
Digital transformation has multiplied the number of interconnected systems, third-party relationships, and employee-facing digital touchpoints. Every touchpoint represents an expanded attack surface, and transformation without commensurate security measurement creates risk rather than resilience.
Cyber risk benchmarking solves the boardroom credibility problem that has plagued cybersecurity for decades. Rather than asking executives to fund initiatives based on technical severity scores, security leaders can present comparative data showing how detection speed measures up against industry medians.
That framing converts security from a faith-based expenditure into a measurable business function. It justifies investment with evidence, identifies control gaps before cyberattackers exploit them, and provides board-level assurance that security spending produces verifiable results rather than activity reports.
For organizations managing human-layer risk, continuous benchmarking of phishing simulation click rates, cybersecurity training completion velocity, and employee reporting speed provides the data layer that turns security awareness from a compliance checkbox into a defensible risk reduction program. Without that data, even well-funded cybersecurity training programs remain unaccountable.
The Three Types of Cyber Risk Benchmarking: Standards, Peer, and Internal
Organizations that rely on a single yardstick for cyber risk benchmarking see only part of the picture. Each type of benchmarking answers a different question: standards-based benchmarking evaluates whether controls measure up to an established framework, peer benchmarking reveals how security posture compares against similar organizations, and internal benchmarking tracks whether an organization's own performance is improving over time.
Mature security programs use all three approaches because each one covers blind spots the others miss.
How Do the Three Types of Cyber Risk Benchmarking Compare?
Standards-based benchmarking answers whether controls are adequate against a recognized yardstick. It proves useful during audits, compliance reviews, and board justifications where documented due diligence carries weight.
Peer benchmarking answers whether an organization performs better or worse than similar organizations. It delivers value when setting security targets, negotiating cyber insurance premiums, or evaluating how a merger target's posture compares to industry norms.
Internal benchmarking answers whether performance is improving. It is the only measurement type that reveals whether security spending and program investment are producing real improvement.
The data sources behind each type of cyber risk benchmarking differ fundamentally:
- Standards-based benchmarking draws on internal audits, control assessments, policy reviews, and penetration test results, evidence the organization generates and controls;
- Peer benchmarking pulls from externally observable signals such as open ports, misconfigured DNS, botnet infections, patching cadence, and SSL certificate health, all collected without input from the rated organization;
- Internal benchmarking relies on operational telemetry that only the organization possesses, including mean time to detect (MTTD), phishing simulation click rates, and cybersecurity training completion metrics.

Standards-Based Cyber Risk Benchmarking
Standards-based cyber risk benchmarking evaluates security controls against a published framework. The most commonly used frameworks include the NIST Cybersecurity Framework (CSF), the CIS Critical Security Controls, and ISO/IEC 27001.
Each framework provides a structured catalog of controls organized by function or domain, and organizations assess implementation maturity using tiers, maturity levels, or pass/fail scoring.
The limitation is equally clear: framework maturity does not guarantee real-world resilience. An organization can score well on control implementation while remaining exposed to novel attack paths, particularly AI-generated cyber threats that bypass documented controls entirely, reinforcing that compliance functions as a floor rather than a ceiling.
Peer Cyber Risk Benchmarking
Peer cyber risk benchmarking compares security posture against similar entities, typically matched by industry, revenue band, or employee count, using security ratings services.
Bitsight, the dominant provider in this category. The platform ingests more than 400 billion events daily to produce ratings that update continuously without requiring internal data from the rated organization.
The appeal is immediate: a single number positions an organization relative to peers and becomes a common language for boards, insurers, and procurement teams.
The limitation is that these ratings capture only what is externally observable. Internal compensating controls, network segmentation, endpoint detection efficacy, and employee awareness levels remain invisible to outside-in scanning.
When to Use Each Type of Cyber Risk Benchmarking, and Why Leaders Combine All Three
Standards-based benchmarking fits compliance cycles, audit preparation, and new program builds where a prescriptive control framework provides necessary structure. Peer benchmarking delivers maximum value during board presentations, insurance negotiations, and third-party risk assessments, where an objective external score carries credibility internal assessments cannot match.
Internal benchmarking validates whether cybersecurity training investments, tool deployments, and process changes produce measurable behavioral and operational improvement.
Organizations that rely on a single type make avoidable mistakes:
- Framework-only programs create compliant but brittle security postures;
- Peer-score-only approaches incentivize score optimization over genuine risk reduction;
- Internal-only benchmarking produces teams that improve in isolation without knowing whether their baseline was weak or strong to begin with.
Leading programs triangulate across all three approaches. They map controls to NIST CSF or ISO 27001 for audit readiness, track a Bitsight rating for external credibility, and monitor internal metrics such as phishing simulation performance and human risk scoring to prove program efficacy.
That triangulation turns cyber risk benchmarking from a reporting exercise into a genuine decision-making discipline, setting the foundation for measuring whether any security initiative actually works.
Frameworks That Power Effective Cyber Risk Benchmarking
No single framework answers every cyber risk benchmarking question. Each one serves a different purpose: governance, control prioritization, certification, or financial quantification, and the most mature security programs use several frameworks in combination rather than relying on just one.
NIST CSF 2.0 anchors itself in organizational governance, making leadership accountability and supply chain oversight measurable benchmarking criteria for the first time. CIS Controls offers a tactical, prescriptive path that tells teams exactly which safeguards to implement and in what order.
ISO 27001 provides the internationally recognized certification framework that proves benchmarking results to auditors and business partners through a formal Information Security Management System (ISMS). FAIR departs from these approaches entirely: instead of measuring maturity or control coverage on ordinal scales, it quantifies cyber risk in dollar terms so organizations can benchmark potential financial loss exposure directly.
Crosswalking across these frameworks eliminates redundant effort, letting security teams benchmark once and report results against NIST, ISO, CIS, and regulatory requirements simultaneously.
NIST CSF 2.0 and the New Governance Function in Cyber Risk Benchmarking
The NIST Cybersecurity Framework 2.0, released in February 2024, represents the most significant structural change to the framework since its original 2014 publication. It introduces a sixth core function, Govern (GV), that fundamentally redefines what organizations must measure.
The Govern function establishes cybersecurity risk management as an enterprise governance concern rather than an IT operations task. It spans several areas:
- Organizational context and risk management strategy;
- Roles, responsibilities, and policy;
- Oversight mechanisms;
- Supply chain risk management.
The GV.SC (Cybersecurity Supply Chain Risk Management) category within Govern is particularly transformative for cyber risk benchmarking. It requires organizations to assess and measure how cybersecurity risks are managed across an entire third-party ecosystem, not only internally.
For any organization benchmarking its program, this means supplier security posture, vendor risk assessments, and contractual security requirements now count as core measurement criteria rather than peripheral due diligence items.
Unlike its predecessor, NIST CSF 2.0 also provides implementation examples and quick-start guides for organizations of varying sizes, making it accessible to small and mid-sized enterprises that previously found the framework too abstract. The framework remains technology-neutral and non-prescriptive, defining outcomes rather than specific controls, a strength for governance and a limitation for tactical benchmarking.
CIS Controls and ISO 27001: Tactical and Certifiable Cyber Risk Benchmarking
The CIS Critical Security Controls take an aggressively prescriptive and prioritized approach. Version 8 organizes 18 controls into three implementation groups (IG1, IG2, IG3) based on organizational maturity, giving teams a step-by-step roadmap.
IG1 covers essential cyber hygiene, including asset inventory, continuous vulnerability management, and secure configurations, while IG3 addresses advanced defenses for enterprises facing sophisticated cyberattackers. This makes CIS Controls the most actionable cyber risk benchmarking framework for organizations that need to know exactly what to fix next rather than only where they stand.
ISO 27001 serves a different function. It is the only internationally recognized certifiable standard among the major frameworks, requiring organizations to establish and maintain an ISMS.
Benchmarking against ISO 27001 means measuring against the controls in Annex A that an accredited third-party auditor will verify. For organizations operating in regulated industries or competing for enterprise contracts, ISO 27001 certification doubles as a market credential, proving to customers and partners that cybersecurity controls have been independently validated.
FAIR and FAIR-CAM: Financial Quantification for Cyber Risk Benchmarking
Factor Analysis of Information Risk (FAIR) is "the only international standard quantitative model for information security and operational risk", recognized by The Open Group as the standard for cyber risk quantification, a core input to cyber risk benchmarking.
Where NIST, CIS, and ISO produce maturity scores or control coverage percentages, FAIR produces a dollar figure: the probable frequency and magnitude of future loss events. This matters because boards and finance leaders allocate capital in dollars, not maturity ratings.
FAIR decomposes risk into measurable factors and models their relationships mathematically:
- Cyber threat event frequency;
- Vulnerability;
- Loss event frequency;
- Loss magnitude.
FAIR-CAM (Controls Analytics Model), created by FAIR inventor Jack Jones, extends the methodology to controls themselves. It classifies controls into three categories:
- Loss Event Controls;
- Variance Management Controls;
- Decision Support Controls.
FAIR-CAM quantifies how each control category affects the frequency or magnitude of loss, measured in units of frequency, probability, or time, bridging the gap between traditional control assessments and financial loss estimation. Instead of asking whether controls are compliant, FAIR-CAM asks how much each control reduces probable loss exposure and which controls deliver the highest return on investment.

Crosswalking Frameworks to Streamline Cyber Risk Benchmarking
Organizations operating in multiple regulatory environments rarely have the luxury of choosing one framework for cyber risk benchmarking. A multinational company may need to demonstrate alignment with NIST CSF for United States operations, ISO 27001 for European clients, CIS Controls for cyber insurance underwriting, and GDPR for EU data protection, all simultaneously.
Crosswalking solves this by formally mapping controls across frameworks so a single assessment satisfies multiple reporting requirements. The CIS Controls maintain official mappings to NIST CSF, ISO 27001, and multiple regulatory standards that organizations can use directly.
The practical workflow is straightforward: benchmark against one primary framework that matches the organization's operational reality, then use published crosswalk documents to translate results into the language of each additional framework that auditors, insurers, or customers require.
This approach eliminates the redundancy of running separate assessments against separate standards while preserving the depth each framework demands. For organizations integrating human risk metrics into their benchmarking, this crosswalked data can feed directly into broader cyber risk management programs that unify technical controls and employee behavior into a single, defensible measurement.
How to Conduct a Cyber Risk Benchmarking Program: Gap Analysis to Actionable Goals
A cyber risk benchmarking program starts with a structured gap analysis that inventories existing controls, maps them against a chosen framework, and prioritizes deficiencies by risk impact. From that baseline, organizations set precise measurable goals, such as reducing mean time to contain from 72 hours to 24 hours, rather than vague aims like improving incident response.
Organizations validate progress through continuous monitoring rather than episodic audits. Selecting the right cadence for organizational velocity, automating data collection, and using framework profiles to align controls with target maturity levels separates programs that drive real risk reduction from those that produce shelf-bound reports.
1. Perform a Cyber Risk Benchmarking Gap Analysis: Inventory, Map, and Prioritize
The process starts by cataloging every security control currently in place across people, process, and technology layers. This inventory must span beyond technical defenses to include cybersecurity training completion rates, phishing simulation performance, incident response playbooks, and third-party risk processes.
Each control then gets mapped to a recognized framework. The NIST Cybersecurity Framework (CSF) 2.0 organizes security outcomes across six functions: Govern, Identify, Protect, Detect, Respond, and Recover, making it the most broadly adopted mapping structure. For each framework subcategory, teams score the current implementation level as Partial, Risk-Informed, Repeatable, or Adaptive.
Once mapped, control deficiencies emerge by comparing current-state scores against target maturity levels. Gaps should be prioritized by actual risk impact rather than ease of closure; a missing incident response playbook for ransomware should outrank a documentation gap in a low-exposure administrative policy.
The goal of this stage of cyber risk benchmarking is a risk-prioritized remediation backlog rather than a comprehensive inventory of imperfections.
2. Set Specific, Measurable Goals from Cyber Risk Benchmarking Data
The gap analysis reveals exactly where controls fall short, and benchmarking data, whether from industry peers, regulatory standards, or internal historical baselines, provides the yardstick for cyber risk benchmarking.
Replacing "strengthen incident response" with "reduce mean time to contain (MTTC) from 8 hours to 2 hours by Q3" creates accountability. Replacing "improve phishing defenses" with "reduce the phishing simulation click rate from 18% to under 5% across the finance department within two quarters" does the same.
Every goal must name a specific metric, a current baseline, a target value, and a deadline. This precision makes goals auditable and forces honest conversations about the resources required to close each gap.
3. Choose Continuous Monitoring Over Point-in-Time Cyber Risk Benchmarking Assessments
Point-in-time assessments, including annual audits, penetration tests, and maturity assessments, deliver deep but episodic snapshots within cyber risk benchmarking programs. An organization's posture can degrade the day after the assessment closes.
Continuous monitoring uses always-on security ratings platforms, automated control validation, and real-time risk scoring to detect drift immediately. A point-in-time assessment might catch a misconfigured S3 bucket during the annual review window, while continuous monitoring catches it within minutes.
Continuous monitoring applies that same principle of always-on detection and automated validation to control effectiveness, turning drift detection from a months-long blind spot into a minutes-long correction.
4. Automate Cyber Risk Benchmarking Without Adding Headcount
The most common objection to continuous benchmarking is headcount. Security ratings platforms and automated compliance mapping tools eliminate that constraint by ingesting telemetry from existing security tools, mapping controls to multiple frameworks simultaneously, and surfacing gaps through executive dashboards without requiring a dedicated cyber risk benchmarking analyst on staff.
Continuous control monitoring (CCM) automates the validation of whether controls function as designed. If a firewall rule drifts, if multi-factor authentication coverage drops, or if service-level agreement patching is breached, the platform flags it, allowing a benchmarking program to refresh weekly without adding a single full-time equivalent.
5. Align Cyber Risk Benchmarking Cadence to Organizational Velocity
Cyber risk benchmarking cadence should reflect how fast an organization's risk surface changes. Digital-native companies deploying code daily, onboarding cloud services continuously, and operating with high workforce turnover need quarterly or continuous benchmarking.
A SaaS company that releases 50 production changes per week cannot rely on an annual assessment to validate its control posture. Traditional enterprises with slower change cycles, regulated manufacturers, established professional services firms, and organizations with stable infrastructure footprints can run semi-annual or annual benchmarking cycles effectively.
The rule is straightforward: benchmarking cadence must move faster than the rate at which material risks can accumulate undetected. If an attack surface changes in weeks, the benchmarking cadence must match that tempo.
6. Map Controls to Framework Profiles for Cyber Risk Benchmarking
A NIST CSF 2.0 Profile represents the alignment of an organization's specific security requirements, risk appetite, and resources against the framework's outcomes. The Current Profile captures where controls stand today, while the Target Profile defines where they need to be based on business objectives, regulatory obligations, and threat intelligence.
Mapping each control to a target maturity level creates the roadmap. A healthcare organization subject to HIPAA, for example, might target "Repeatable" maturity for the Protect function's data security controls and "Adaptive" for the Detect function's continuous monitoring capabilities.
By attaching maturity targets to every mapped control, organizations transform cyber risk benchmarking from a static scorecard into a living program management tool that tracks progress against defined risk reduction milestones.
Platforms that support continuous human risk monitoring extend this mapping to workforce-level risk indicators, including cybersecurity training completion, phishing simulation performance, and OSINT exposure, giving security leaders a unified view of technical and human-layer control maturity. From this unified baseline, measuring whether the program actually changes behavior becomes the next logical step.
Essential Metrics Every Cyber Risk Benchmarking Program Must Track
A cyber risk benchmarking program without the right metrics is just a reporting exercise. The metrics that matter most are the ones correlating directly with breach likelihood, financial impact, and organizational resilience.
According to IBM's 2025 Cost of a Data Breach Report, organizations took a median of 172 days to identify a breach and 62 additional days to contain it. These two figures make Mean Time to Detect and Mean Time to Respond among the most financially consequential metrics any program can track.
Benchmarking often reveals that budget allocation across technology, process, and people is misaligned with where human-centric risk actually concentrates, a tension explored later in this guide.
How Do MTTD and MTTR Drive Cyber Risk Benchmarking?
Mean Time to Detect (MTTD) measures the gap between cyberattacker entry and discovery. Mean Time to Respond (MTTR) captures the window from detection to full containment and remediation.
Every day, a cyberattacker operates undetected and expands the blast radius. Cyberattackers move laterally, exfiltrate data, and escalate privileges while the response clock keeps running.
Longer dwell time produces larger financial exposure. Benchmarking MTTD and MTTR against industry medians as part of cyber risk benchmarking tells security leaders whether detection engineering and incident response capabilities are competitive or dangerously slow.
What Coverage, Vulnerability, and Access Metrics Matter Most in Cyber Risk Benchmarking?
Vulnerability management cyber risk benchmarking starts with three numbers: mean time to remediate critical vulnerabilities, patching cadence by severity tier, and the percentage of systems within the service-level agreement. Organizations that cannot close critical vulnerabilities within 72 hours of patch availability operate with a permanently open window that cyberattackers increasingly exploit through automation.
Several additional metrics round out a complete picture of technical exposure:
- Endpoint protection coverage, the percentage of endpoints with EDR deployed and actively reporting telemetry, exposes blind spots that ransomware operators target within minutes of initial access;
- Cloud security posture coverage measures what share of cloud assets undergo continuous monitoring for misconfigurations, a growing root cause behind breach headlines;
- Multi-factor authentication adoption rates across user populations quantify credential-based exposure directly;
- Privileged access management coverage for admin and service accounts closes the gap that most often appears in breach post-mortems.
Organizations with MFA adoption below 90% and gaps in PAM coverage for service accounts routinely appear in breach post-mortems, often as the single control that would have stopped the cyberattack. These same access metrics create a direct line of sight to the human behaviors that determine whether credentials become breach-causative.
How Is Human-Layer Resilience Measured in Cyber Risk Benchmarking?
Security awareness training effectiveness is measurable through three direct indicators that reveal whether the human layer is strengthening or weakening. Phishing simulation click-through rates show baseline susceptibility, and mature programs track this number quarter over quarter, driving it consistently downward through targeted intervention.
Reporting rates measure how many employees flag suspicious messages before interacting, among the strongest predictors of organizational detection speed during real incidents. An employee who reports a phishing simulation in 90 seconds shortens a cyberattacker's operational window dramatically.
Repeat failure rates identify employees who click across multiple phishing simulation campaigns, flagging where targeted one-on-one coaching is necessary rather than another generic cybersecurity training module.
These metrics transform cybersecurity training into a quantifiable risk reduction program central to cyber risk benchmarking. Organizations that track them over consecutive quarters can demonstrate measurable improvement or catch deterioration before a real phishing email exploits it, connecting human risk management investment directly to security outcomes.
How Is Security Tool Effectiveness Evaluated in Cyber Risk Benchmarking?
Security tool effectiveness evaluation, a core piece of cyber risk benchmarking, answers a direct question: Are deployed tools detecting and preventing the cyber threats they were purchased to address? If an EDR misses 8% of known adversary techniques or a cloud security tool fails to detect publicly exposed storage buckets, the gap translates directly into risk exposure that no amount of spending can close.
This evaluation must be continuous rather than annual, since tool performance drifts as configurations change, detection rules age out, and cyber threat techniques evolve. Organizations that run quarterly control validation and compare results against initial procurement benchmarks surface degradation before it becomes breach-causative.
Why Budget Allocation Determines Cyber Risk Benchmarking Success
That split tilts heavily toward tools, despite stolen credentials being involved in 13% of all breaches according to Verizon's 2026 Data Breach Investigations Report, a figure that points squarely at human-layer exposure.
Cyber risk benchmarking reveals whether spending aligns with measured risk concentration. Organizations that rebalance toward the human layer after reviewing their own phishing simulation and reporting data consistently close the gap between budget allocation and actual cyber threat exposure.
Cyber Risk Quantification and Cyber Risk Benchmarking: Expressing Risk in Dollars
Boardrooms do not allocate capital based on CVSS scores. They act on dollar-denominated risk projections that sit alongside revenue, operating margin, and competing investment priorities.
Jack Freund's article 'From Measurement to Management: Integrating Cyberrisk Quantification into Risk Governance,' published in the ISACA Journal Volume 5, 2024, confirms that annualized loss expectancy (ALE) figures are the prerequisite for translating technical security data into financial language.
Feeding those dollar figures into cyber risk benchmarking against peers, industry loss data, and insurer risk assessments transforms a single-point estimate into a defensible business case for where an organization stands and where investment must flow.
How Does the FAIR Model Decompose Cyber Risk for Benchmarking Into Financial Terms?
The Factor Analysis of Information Risk (FAIR) model is the dominant framework for cyber risk quantification because it breaks risk into two components central to cyber risk benchmarking: how often a loss event occurs and how much it costs when it does.
Loss Event Frequency captures the probable number of times a cyber threat agent acts against an asset and succeeds within a given year. Loss Magnitude measures the financial impact, including direct response costs, legal liability, regulatory fines, and reputational damage, of each successful event.
Multiplying these two variables produces Annualized Loss Expectancy. A phishing-related data breach with an estimated frequency of 0.4 events per year and a per-incident loss magnitude of $4.2 million yields an ALE of $1.68 million, letting a security leader state that current phishing risk costs the organization roughly that amount per year in expected losses.
The FAIR Institute's unified framework strengthens this by incorporating control effectiveness analytics (FAIR-CAM), which measures how specific security controls reduce either the frequency or magnitude of loss events, making risk reduction directly attributable and budgetable.
When ALE figures are compared across business units, finance versus engineering, United States versus EMEA, resources get allocated based on modeled loss exposure rather than intuition.
What Is Return on Security Investment (RoSI) and How Does It Strengthen Cyber Risk Benchmarking?
Return on Security Investment measures the modeled reduction in ALE produced by a specific security control, divided by that control's total cost of ownership. The formula cuts through the ambiguity that has historically plagued cybersecurity budgeting.
Tracking RoSI requires continuous measurement as part of ongoing cyber risk benchmarking rather than annual point-in-time assessments. Organizations that re-run FAIR analyses quarterly can detect when controls degrade, when employee phishing simulation click rates drift upward months after cybersecurity training, and adjust investment before risk accumulates.
A security leader who demonstrates that underfunding a control by $150,000 exposes the organization to an additional $900,000 in modeled loss makes a financial argument no finance leader ignores. Over successive quarters, RoSI trendlines reveal whether the security program is becoming more or less capital-efficient, a metric that belongs in every board deck.
How Does Cyber Insurance Underwriting Serve as an Independent Cyber Risk Benchmarking Signal?
Cyber insurance carriers function as an external, market-driven risk quantification engine that feeds directly into cyber risk benchmarking. Underwriters assess security posture across dozens of variables, including:
- Incident response capability;
- Multi-factor authentication coverage;
- Endpoint detection maturity;
- Cybersecurity training frequency.
Underwriters assign a premium that directly reflects their modeled probability of loss. When an organization's premium runs 40% higher than the sector median for companies of comparable revenue, that differential is an independent actuarial signal that its security posture trails peers.
Coverage requirements themselves have become a de facto benchmarking mechanism, since insurers increasingly mandate specific controls as conditions of coverage:
- Phishing simulations for all employees;
- Privileged access management;
- Offline backups.
Organizations that fail these underwriting criteria either pay substantially higher premiums or cannot secure coverage at all. A company whose FAIR analysis shows ransomware ALE of $3 million but whose insurer prices coverage as though exposure runs $7 million has uncovered a modeling gap that demands investigation. This external validation loop forces rigor that purely internal quantification lacks.
How Does CRQ Enable Cyber Risk Benchmarking Against Industry and Peer Loss Data?
The final step in cyber risk benchmarking connects an organization's dollar-denominated risk to external reference points. Industry loss data repositories aggregate thousands of anonymized incidents with categorized loss magnitudes by sector, organization size, and root cause.
A financial services firm whose business email compromise ALE sits at the 80th percentile of peer data has quantitative justification for prioritizing those controls, regardless of what internal severity ratings might suggest.
This approach also strengthens the case for human-layer defense investment. When an organization identifies that employee-targeted phishing represents 60% of its modeled loss exposure, the financial logic of investing in security awareness training and phishing simulations becomes unambiguous.
The conversation shifts from a generic call to train employees toward a quantified claim that closing the phishing exposure gap reduces ALE by an estimated $1.2 million, delivering an RoSI of 6:1 over three years. That business case transforms cybersecurity from a cost-center line item into a capital allocation decision with measurable return, precisely the evidence boards need to approve program expansion before the next budget cycle closes.
Communicating Cyber Risk Benchmarking Results to the Board and C-Suite
Transforming cyber risk benchmarking data into a leadership narrative means replacing raw scores with peer percentile rankings, attaching dollar figures to every identified gap, and framing remediation investments as risk reduction with a measurable return.
Effective presentations are structured around three questions every board wants answered: what cyber threats target similar organizations, what actions reduced that risk, and what current exposure looks like in terms boards recognize, including financial loss, regulatory liability, and insurance impact. No metric should appear without its business consequence attached.

1. Structure the Executive Cyber Risk Benchmarking Report for Leadership
Boards do not need 47-slide decks of technical indicators. They need a one-page executive summary that opens with a top-line cyber risk benchmarking posture rating, a single letter grade or color-coded score that immediately signals whether the organization is leading, keeping pace, or falling behind.
That rating should be followed by peer comparison visualizations built from percentile rankings rather than raw numbers. Stating that an organization ranks in the bottom quartile among financial services peers on human-layer resilience triggers the right governance reflex far more effectively than a raw phish-prone percentage.
Beneath the peer comparison, trend lines covering at least four quarters tell the real story; a single data point is noise, while a downward slope over twelve months is a narrative. Directors govern trajectory rather than snapshots.
The summary should close with a prioritized gap list of no more than three items, where each identified vulnerability carries a remediation cost estimate and a projected risk reduction figure. When a board member asks what it will take to fix a gap, the answer should already be on the page.
2. Translate Cyber Risk Benchmarking Gaps into Financial Consequences
Every technical metric in a cyber risk benchmarking presentation must be paired with its implied financial exposure. Mean time to detect (MTTD) and mean time to respond (MTTR) are not security operations statistics; they function as multipliers on breach cost.
An organization with a 200-day dwell time is not just slow. It carries statistically elevated exposure to the full financial impact that IBM's 2025 Cost of a Data Breach Report documented at $4.44 million.
Patching cadence is not merely an IT hygiene metric. It functions as a direct input into cyber insurance underwriting, and when renewal premiums shift based on security posture, the board connects patching gaps to a line item it already scrutinizes.
This translation shifts budget conversations from defensive to strategic. When leadership sees an organization ranks below peers on phishing resilience, and that gap maps to an estimated $3.2 million in implied breach exposure, the question changes from whether the program is needed to what it will take to close the gap.
3. Map Cyber Risk Benchmarking Data to SEC Disclosure Requirements
The SEC's cybersecurity disclosure rules, adopted in July 2023, require public companies to disclose their processes for assessing, identifying, and managing material cybersecurity risk and to describe the board's oversight of those risks in annual reports.
Benchmarking data directly supports these obligations by providing evidence that an organization operates a reasonable, measured risk assessment process rather than an ad hoc one.
A cyber risk benchmarking report showing consistent quarterly measurement against peers, trended improvement over time, and documented board review of results generates defensible disclosure material rather than simple risk management activity. Regulators and plaintiff attorneys increasingly ask the same question: Did leadership knowingly leave the organization exposed relative to industry norms?
Benchmarking data demonstrating active measurement and gap remediation provides the board with evidence of oversight maturity that no policy document alone can match.
4. Bridge Operational and Financial Cyber Risk Benchmarking Metrics in a Single Narrative
The most effective board presentations alternate between technical and financial lenses within the same story. Introducing phishing simulation click rates alongside the projected cost of a successful credential theft incident keeps both dimensions visible.
Presenting MTTD data next to the breach cost curve that grows with dwell time and mapping cybersecurity training completion percentages to human risk score trends connects those trends to insurance premium negotiations already underway.
This dual-lens approach keeps both audiences engaged. The CFO and audit committee chair process the financial framing, while the CEO and independent directors absorb the operational soundness signal.
Both groups leave the room equipped to exercise the oversight the SEC now mandates and that cyber insurers increasingly expect as a condition of coverage. A well-structured cyber risk benchmarking report, supported by continuous measurement and board-ready dashboards, transforms the quarterly security update from a compliance obligation into a strategic governance asset.
Specialized Cyber Risk Benchmarking: Third-Party Risk, OT/ICS, and Industry-Specific Approaches
Most organizations start cyber risk benchmarking with IT-centric frameworks: NIST CSF maturity scores, phishing simulation click rates, and patching cadence metrics.
That baseline matters, but it misses entire attack surfaces that cyberattackers actively exploit. Benchmarking third-party vendor risk, operational technology environments, multi-cloud sprawl, and industry-specific regulatory postures requires different data sources, different metrics, and different evaluation cadences.
1. Conduct Third-Party and Vendor Cyber Risk Benchmarking with Ratings, Questionnaires, and Continuous Monitoring
Third-party risk has become a primary attack vector. According to SecurityScorecard's 2025 Global Third-Party Breach Report, 35.5% of all data breaches in 2024 originated from third-party compromises.
Standard IT benchmarking frameworks measure what happens inside an organization's own perimeter. They remain blind to the vendor ecosystems that now represent more than a third of breach origin points.
IBM's 2025 Cost of a Data Breach Report pegged the average third-party breach cost at over $4.91 million, underscoring why vendor exposure deserves its own benchmarking discipline rather than an afterthought within IT metrics.
Effective third-party cyber risk benchmarking combines three assessment layers:
- Security ratings services produce a numerical score by analyzing externally visible indicators across every vendor in a portfolio, including open ports, SSL certificate hygiene, known vulnerabilities, and dark web credential exposure, creating an objective baseline that requires no vendor cooperation;
- Questionnaire-based assessments validate specific controls that ratings cannot see, such as access management policies, encryption standards, and incident response procedures;
- Continuous monitoring closes the gap between assessments, flagging rating drops, new vulnerabilities, or data leak chatter as they emerge rather than at the next scheduled review.
Neither security ratings nor questionnaires alone prove sufficient, and neither should operate on an annual refresh cycle.

2. Measure Supply Chain Concentration Risk as Part of Cyber Risk Benchmarking
Beyond individual vendor health lies concentration risk: the aggregated exposure created when too many critical business functions depend on a small number of suppliers or service providers. An organization might have excellent security ratings across 200 vendors but still face catastrophic risk if three of them form a dependency chain that touches every revenue operation.
One cloud provider, one payment processor, and one authentication vendor can become a single failure cascade. Concentration risk benchmarking, a specialized branch of cyber risk benchmarking, maps critical business processes to their enabling vendors, then quantifies how few failure points could disrupt how many revenue-generating or patient-safety functions.
The Cyentia Institute found that for each direct third-party relationship, organizations typically carry indirect dependencies on 60 to 90 times more fourth parties. Benchmarking must account for that multiplier.
High concentration scores demand compensating controls, including redundant vendors for critical paths, enhanced monitoring frequency, and contractual incident response guarantees that exceed baseline requirements.
3. Separate OT/ICS Cyber Risk Benchmarking from IT, Safety Metrics Come First
Industrial control systems and operational technology environments cannot be benchmarked with the same frameworks used for enterprise IT, because the priorities are inverted. In IT, confidentiality often ranks first; in OT, safety impact and operational availability override everything else.
The Purdue model segmentation defines specific levels, from physical process (Level 0) through enterprise systems (Level 5), and each requires its own measurement approach. A plant floor PLC running a chemical process cannot be evaluated by patch cadence alone; the benchmark must account for whether patching would require a safety shutdown and whether that shutdown risk exceeds the vulnerability risk.
CISA's Cross-Sector Cybersecurity Performance Goals provide a cyber risk benchmarking framework designed specifically for critical infrastructure operators, aligning with NIST CSF 2.0 while accommodating the safety-first operational constraints that IT frameworks ignore.
The Dragos 2026 OT Cybersecurity Year in Review documented continued cyberattacks against water treatment, energy distribution, and manufacturing environments where IT-native detection tools failed to register anomalous commands on proprietary industrial protocols.
Effective OT benchmarking measures several distinct factors:
- Segmentation enforcement between Purdue levels;
- Engineered safety system isolation;
- Mean time to detect process anomalies;
- The percentage of OT assets with known vulnerabilities assessed for safety impact rather than CVSS score alone.
4. Assess Hybrid and Multi-Cloud Cyber Risk Benchmarking Posture with Consistent Cross-Platform Metrics
Organizations running workloads across AWS, Azure, GCP, and on-premises data centers face a measurement fragmentation problem. Each cloud provider offers native security posture scoring, such as the AWS Security Hub score, Azure Secure Score, and GCP Security Command Center findings, but each calculates scores differently, uses different severity weightings, and updates at different frequencies.
A 90% secure posture on Azure does not mean the same thing as 90% on GCP. Benchmarking across environments requires normalizing these disparate scores into a consistent framework that applies identical evaluation logic to every environment.
Effective multi-cloud cyber risk benchmarking starts with a unified control set, mapping each provider's native findings to a common taxonomy such as the CIS Benchmarks or the Cloud Security Alliance's Cloud Controls Matrix.
The benchmark then tracks not just the raw score per environment but the variance between environments. A 20-point gap between AWS and Azure posture scores signals a configuration management breakdown rather than a tooling difference alone.
The metric that matters most is consistency: whether the same misconfiguration, an open S3 bucket on AWS or an open blob container on Azure, gets caught at the same speed regardless of which team owns the account.
5. Approach Cyber Risk Benchmarking as an SMB with Free Tools, Insurance Questionnaires, and CIS IG1 Essentials
Small and midsize businesses rarely have dedicated risk management headcount, but the need for cyber risk benchmarking does not scale down with organizational size. The consequences of missing a critical exposure carry the same weight regardless of company size.
SMBs can build a defensible benchmark using three low-resource methods:
- Free assessment tools, such as CISA's Cyber Hygiene Vulnerability Scanning for continuous external monitoring at no cost and the NIST CSF self-assessment tool for maturity scores mapped to a globally recognized framework without consultant fees;
- Cyber insurance questionnaires, which function as a de facto benchmark proxy, since the controls insurers require, including MFA enforcement, endpoint detection, backup isolation, and privileged access management, directly reflect what underwriters have identified as reducing claim probability;
- The CIS Controls Implementation Group 1 (IG1) defines a set of essential safeguards covering basic cyber hygiene such as asset inventory, continuous vulnerability management, controlled use of administrative privileges, and data recovery.
IG1 was designed specifically for organizations with limited IT resources. Achieving full IG1 compliance is a concrete, measurable benchmark that aligns with both insurer expectations and regulatory minimums.
6. Align Cyber Risk Benchmarking to Industry-Specific Regulations That Shift Priorities Per Sector
Industry regulations do not just impose compliance requirements. They define the cyber risk benchmarking within each sector.
Each regulated sector measures different priorities:
- Healthcare organizations regulated under HIPAA benchmark access control audit completeness and PHI encryption coverage rather than generic asset inventory scores;
- Payment card environments under PCI DSS prioritize segmentation validation, key management maturity, and quarterly ASV scan pass rates;
- Energy sector operators subject to NERC CIP requirements measure electronic security perimeter enforcement, supply chain risk management documentation, and incident response plan testing against a 15-calendar-day reporting threshold.
A hospital, a payment processor, and a utility might all score 80% mature on a generic framework, but that number means nothing if the remaining 20% includes the specific controls a regulator considers non-negotiable.
Sector-specific benchmarking starts with the regulation's control catalog as the evaluation framework, measures only those controls, and reports maturity against the regulator's own definitions rather than an external standard.
7. Validate Cyber Risk Benchmarking Scores with Red Team and Penetration Test Results
No self-reported maturity score, external rating, or compliance attestation substitutes for real-world testing. Red team engagements and penetration tests provide the only evidence that benchmark scores translate into actual defensive capability.
An organization might benchmark at 85% maturity on access control, but if a red team walks through the front door with credentials harvested from a single successfully phished employee, that score needs recalibration.
Organizations with mature cyber risk benchmarking programs track the delta between framework scores and test outcomes as a leading indicator of measurement accuracy. A narrow delta, where penetration test findings align with what the benchmark predicted, validates the scoring model.
A wide delta means the benchmarks measure the wrong things, or measure them incorrectly, and the framework needs revision before it produces useful risk data. That gap between what gets measured and what a cyberattacker actually exploits separates a benchmark that informs decisions from one that creates false confidence.
Overcoming Cyber Risk Benchmarking Challenges and Preparing for What Is Next
When organizations attempt cyber risk benchmarking without addressing data fragmentation, inconsistent metrics, and siloed security domains, they produce comparisons that are misleading at best and dangerously complacent at worst.
The SEC has already penalized multiple companies for deficient cybersecurity disclosures, with civil penalties ranging from $990,000 to $4 million per incident in recent enforcement actions. Organizations that fail to adapt their benchmarking to macroeconomic pressures and emerging AI capabilities will find their security posture assessments increasingly detached from operational reality, widening the gap between perceived and actual risk until an incident exposes it.
Why Fragmented Data Produces Unreliable Cyber Risk Benchmarking Results
Most security teams pull cyber risk benchmarking data from 50 or more disparate tools. SIEMs, vulnerability scanners, EDR platforms, cloud security consoles, and manual spreadsheets each define "critical vulnerability" or "incident" differently, turning aggregation into a reconciliation challenge.
The result is a benchmark built on inconsistent definitions that no peer organization would recognize as comparable.
The problem deepens when organizations rely on self-reported or externally observed data. Peer benchmarks sourced from surveys suffer from response bias, since organizations that have suffered breaches often decline to participate, while those with mature programs self-select in.
Without continuous, automated data collection across integrated tools, annual assessments become outdated the moment they finish. Validating whether a peer's claimed patching cadence or mean time to detect reflects reality remains, in most cases, impossible.
The Convergence Gap Between Cyber and Physical Security in Cyber Risk Benchmarking
Managing cyber and physical security in separate organizational silos creates a blind spot that cyberattackers exploit systematically. A breached RFID badge system becomes physical access, and a compromised building management system becomes network access.
Most benchmarking frameworks treat these domains as unrelated, yet cyberattackers move through whichever door is open and converge on the target.
When cyber risk benchmarking programs ignore physical security controls, they miss half the attack surface. A financial services firm might score in the top quartile for cyber maturity while leaving server rooms accessible with a single tailgated badge swipe; the benchmark says low risk, while reality says otherwise.
Convergence is not an aspirational framework. It is the minimum requirement for a benchmark that reflects the actual pathways cyberattackers use.
How Macroeconomic Pressure Reshapes Cyber Risk Benchmarking Baselines
Recession-driven budget compression, inflation-driven tool cost increases, and persistent cybersecurity talent shortages do not merely slow program execution. They shift the baseline against which performance gets measured.
When a security team shrinks by 15% while the threat surface expands through cloud adoption and third-party integrations, maintaining last year's cyber risk benchmarking score actually represents a degradation. The organization is doing less with less, and the benchmark must reflect that deterioration rather than masking it.
Organizations that hold headcount steady during industry-wide layoffs may see their relative peer standing improve without making any programmatic changes. Both scenarios demand that security leaders recalibrate benchmarking expectations against macroeconomic context rather than treat peer comparisons as static.
Agentic AI and the Autonomous Future of Cyber Risk Benchmarking
Agentic AI, meaning systems that reason, plan, and act without continuous human prompting, is already reshaping cyber risk benchmarking. These AI agents continuously assess control effectiveness, compare posture against real-time threat intelligence feeds, and recommend remediation actions without waiting for a quarterly review cycle.
A January 2026 arXiv survey on agentic AI in cybersecurity finds that agentic systems enable continuous monitoring, autonomous incident response, adaptive threat hunting, and fraud detection. These capabilities support a shift toward more automated security workflows, where tasks traditionally handled through manual analysis and reporting can be partially or progressively augmented by autonomous systems.
The operational implication is straightforward: automation decouples benchmarking maturity from headcount. Organizations can deepen assessment frequency and coverage without adding staff, because AI agents handle the data normalization, gap identification, and trend analysis that currently require dedicated personnel.
Benchmarking shifts from a periodic, labor-intensive project to a continuous, always-on capability that surfaces risk posture changes in hours rather than quarters.
SEC Disclosure Rules Are Making Cyber Risk Benchmarking a Compliance Imperative
The SEC's cybersecurity disclosure rules, effective December 2023, require public companies to disclose material cybersecurity incidents within four business days and to describe their processes for assessing, identifying, and managing material cyber risks annually in Form 10-K filings.
These requirements make rigorous, auditable cyber risk benchmarking non-negotiable. When a company discloses its risk management practices, the SEC expects evidence.
The enforcement signal is clear. The SEC has pursued charges against companies that framed cybersecurity risks in "generic or hypothetical terms despite knowing the threats had materialized," resulting in multi-million-dollar penalties.
Benchmarking that cannot withstand regulatory scrutiny because it relies on unvalidated peer data, inconsistent metrics, or manual collection processes creates legal exposure that compounds the security risk it was meant to reduce. Organizations can address this by adopting continuous human risk scoring that generates the auditable evidence trail regulators now expect.
How Security Awareness Training Strengthens Cyber Risk Benchmarking
Security awareness training generates the human-layer data that cyber risk benchmarking requires but rarely captures: phishing simulation click-through rates by department, repeat failure patterns, and reporting speeds that quantify the precise control gap technical scans miss.
According to Verizon's 2026 Data Breach Investigations Report, 62% of confirmed incidents involve a human element.
An organization with flawless patching cadence and a 40% phishing simulation click rate carries risk no vulnerability scanner can surface.
Feeding behavioral data into risk models closes the blind spot between what technical benchmarks measure and what cyberattackers actually exploit. Social engineering remains the dominant initial access vector, and no endpoint agent will ever detect a finance employee who trusts the wrong voice on the phone.
Why Does Cyber Risk Benchmarking Overlook Human Behavior?
Most cyber risk benchmarking frameworks grew out of technical audit traditions, measuring patch latency, endpoint coverage, firewall rule compliance, and vulnerability remediation speed. These metrics are machine-generated, easy to pull from existing tools, and fit neatly into spreadsheets.
Human behavior data is messier, requires dedicated phishing simulation infrastructure, and has historically been treated as a compliance checkbox rather than a risk metric. The consequence is a structural gap: an enterprise can score in the 95th percentile on technical control benchmarks while maintaining a phishing simulation click-through rate that effectively guarantees a breach.
Frameworks such as NIST CSF 2.0 now include security awareness and cybersecurity training as a specific control category, signaling that regulators and standard-setters are beginning to close this gap, though adoption still lags behind the pace of cyber threats.
What Quantitative Data Does Security Awareness Training Supply to Cyber Risk Benchmarking?
A properly instrumented security awareness program produces benchmarking-ready data across four categories:
- Phishing simulation failure rates, measured by department, role, and individual, show where susceptibility clusters within the organization;
- Repeat offender tracking identifies the percentage of employees who fail multiple phishing simulations across different cyberattack types, a stronger predictor of real-world compromise than a single click metric;
- Reporting speed, measured in minutes from phishing delivery to Phish Alert Button activation, reveals how quickly the workforce escalates cyber threats to the security team;
- Cybersecurity training completion and time-to-completion data show whether the workforce actually engages with remediation content.
When these data points are aggregated into a unified human risk score, they become directly comparable across business units and over time. Finance might show a 12% click rate on vendor impersonation simulations while engineering shows 3%, a difference technical benchmarks alone cannot explain or surface.
This granularity turns human risk monitoring into a measurable, board-reportable dimension of cyber risk benchmarking.
How Does Multi-Channel Cybersecurity Training Data Close the Cyber Risk Benchmarking Gap?
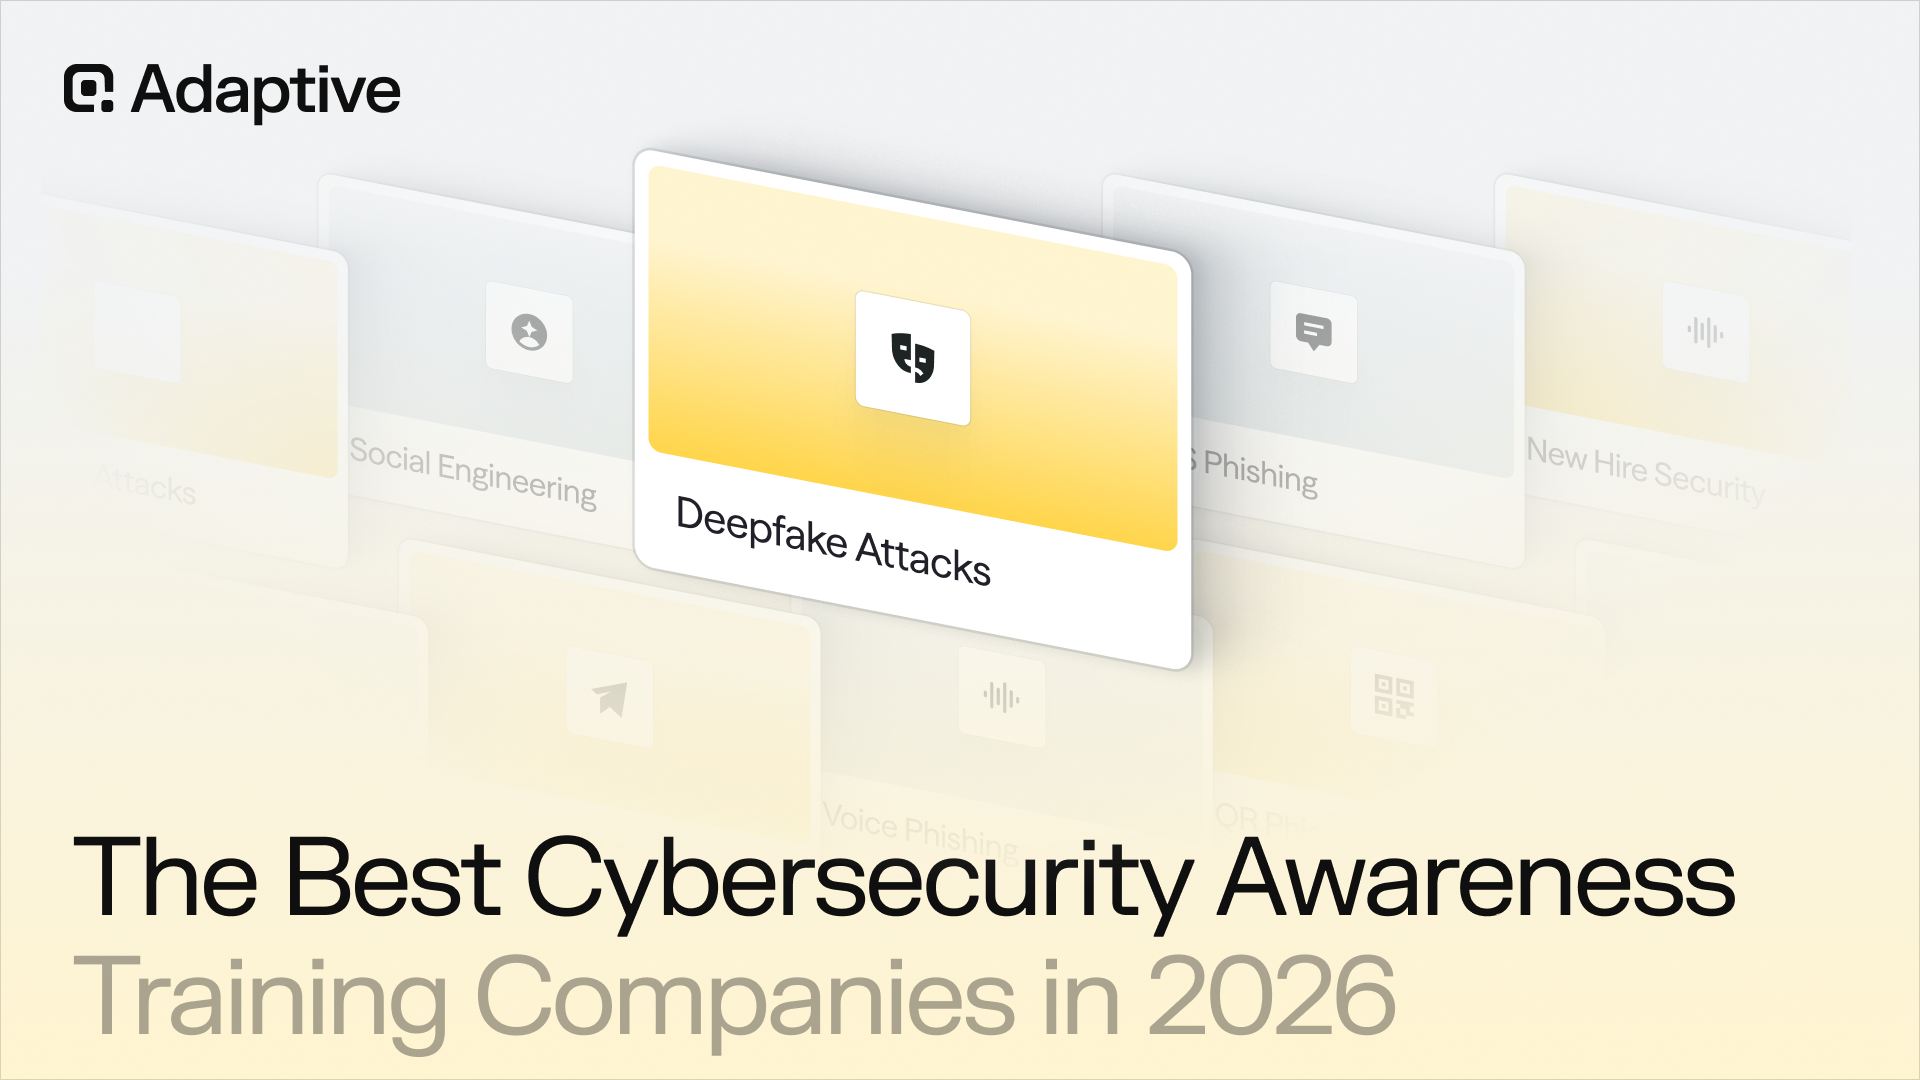
Email-only phishing simulations generate a dangerously narrow signal. An employee who never clicks a phishing email link might still transfer funds after a deepfake video call or share credentials following a vishing call using an AI-cloned executive voice.
Multi-channel simulations, covering phishing emails, vishing calls, smishing texts, and deepfake videos, produce richer benchmarking data that reflects how today's cyberattacks actually work.
Continuous cybersecurity training, triggered automatically when an employee fails a phishing simulation, ensures that measurement and improvement operate in a closed loop. Each failure generates a data point that refines the organization's benchmark, and each benchmark informs more targeted training.
This turns cyber risk benchmarking from a static annual report into an ongoing risk reduction engine. The data exists inside every organization; most security teams have simply never collected it.
Map Human Risk Data Into a Cyber Risk Benchmarking Program With Adaptive Security
Most cyber risk benchmarking programs stop at technical controls, leaving a leading initial access vector in breaches almost entirely unmeasured: human behavior. When phishing simulation data, cybersecurity training completion rates, and repeat-failure trends are integrated into the same benchmarking framework as patching cadence and MFA coverage, organizations close a critical gap that external security ratings cannot capture.
Adaptive Security generates that human-layer telemetry and maps it directly into a broader cyber risk benchmarking program, turning phishing simulation results, multi-channel training data, and reporting speed into board-ready metrics that sit alongside technical control scores. The result is a benchmarking program that finally accounts for the human layer where most breaches actually originate.
A self-guided tour shows how Adaptive Security brings human risk data into a cyber risk benchmarking program.
Cyber Risk Benchmarking Key Takeaways
- Cyber risk benchmarking is the continuous measurement of security posture against internal baselines, peers, and standards. It is distinct from one-time maturity assessments, which only capture a single point in time.
- Three types are used together: standards-based (NIST CSF, CIS Controls, ISO 27001) for audits and compliance; peer-based (e.g., Bitsight ratings) for external comparison valued by boards and insurers; and internal tracking (MTTD, phishing click rates) to prove whether a program is actually improving.
- NIST CSF 2.0 added a "Govern" function covering supply chain risk; CIS Controls offer a prescriptive, tiered (IG1–IG3) roadmap; ISO 27001 is the only certifiable standard; FAIR/FAIR-CAM convert risk into dollar terms (Annualized Loss Expectancy) for financial decision-making.
- Building a program follows a sequence: gap analysis → specific measurable goals → continuous (not point-in-time) monitoring → automation to avoid headcount strain → cadence matched to how fast the organization's risk surface changes → mapping controls to NIST Profiles.
- The metrics that matter most are MTTD/MTTR, vulnerability remediation speed, MFA/PAM coverage, and human-layer indicators (phishing simulation click rates, reporting speed, repeat-offender rates). The last of which most technical frameworks historically ignore, despite humans being involved in the majority of breaches.
- FAIR-based ALE and Return on Security Investment (RoSI) calculations let security leaders justify budgets in dollar terms that insurers and boards already understand; cyber insurance underwriting itself serves as an independent, market-based benchmark.
- Effective board reporting uses peer percentiles (not raw scores), multi-quarter trend lines, dollar-denominated gap impact, and ties directly to SEC disclosure obligations.
- Specialized contexts require tailored approaches: third-party/vendor risk (now a top breach vector), OT/ICS (safety overrides confidentiality), multi-cloud (normalizing inconsistent native scores), SMBs (free tools + insurance questionnaires + CIS IG1), and sector-specific regulation (HIPAA, PCI DSS, NERC CIP).
- Emerging pressures, data fragmentation across tools, cyber-physical security silos, macroeconomic budget compression, and agentic AI are pushing benchmarking toward continuous, automated, always-on measurement rather than periodic reporting.
Bottom Line
Cyber risk benchmarking turns security from a subjective, point-in-time activity into a continuous, multi-dimensional discipline that combines standards, peer data, and internal metrics, including human-layer behavior, to demonstrate whether risk is actually decreasing.
Frequently Asked Questions About Cyber Risk Benchmarking
What Is a Good Cyber Risk Benchmarking Score on the Bitsight Ratings Scale?
A good Bitsight security rating sits at 700 or above on the 250-to-900 scale, where the current achievable range spans 300 to 820. A score above 700 places an organization in the upper tier of the entities Bitsight monitors and correlates with measurably lower breach probability within a broader cyber risk benchmarking program, according to Bitsight's ratings methodology.
Ratings below 500 signal significant control gaps and elevated incident likelihood. What matters more than any single score is the trend line: a 620 that consistently rises quarter over quarter often reflects stronger security program maturity than a stagnant 720.
Organizations should benchmark scores against peers in the same sector and revenue band rather than against the full global dataset, since industry-specific risk profiles shift what constitutes a strong posture.
Can Small and Mid-Sized Businesses Perform Cyber Risk Benchmarking Without a Dedicated Security Team?
Yes. Small and mid-sized businesses can perform effective cyber risk benchmarking without a dedicated security team by using free framework assessment tools, leveraging cyber insurance underwriting questionnaires as a benchmark proxy, and focusing on the CIS Controls Implementation Group 1 (IG1) essential controls.
The IG1 set defines a prioritized list of essential safeguards that SMBs with limited IT resources can realistically implement and measure against. Security ratings services offer entry-level tiers that provide external-in peer comparisons without requiring in-house analysts.
Many SMBs also use their insurer's risk assessment process as a no-cost external benchmark, since underwriting evaluation quantifies control gaps that directly affect premium pricing. The key is selecting a narrow, achievable framework target rather than attempting enterprise-scale benchmarking across all 20 CIS Controls or the full NIST CSF catalog.
What Is the Difference Between a Security Audit and Cyber Risk Benchmarking?
A security audit is a point-in-time compliance check that verifies whether specific controls meet a prescribed standard on a single assessment date. Cyber risk benchmarking is an ongoing measurement process that compares an organization's security posture against internal baselines, industry peers, or established frameworks over time.
An audit answers whether the organization was compliant on a given date, while benchmarking answers how the organization compares and whether it is improving. Audits follow fixed checklists tied to regulations such as PCI DSS or HIPAA, while benchmarking draws on continuously refreshed data from security ratings, automated control validation, and real-time risk scoring to track performance across multiple dimensions simultaneously.
Leading organizations use both. Audits provide compliance evidence for regulators, and benchmarking surfaces the control gaps and risk trends that audits alone cannot reveal between assessment cycles.
How Does Cyber Insurance Underwriting Data Improve the Accuracy of Cyber Risk Benchmarking?
Cyber insurance underwriting data improves benchmarking accuracy by providing an independent, market-based validation of an organization's relative security posture. Insurers aggregate extensive datasets combining external perimeter scanning, dark web intelligence, historical loss events, and premium differentials across thousands of policyholders, creating a risk signal that no internal assessment can replicate.
When an insurer assigns a higher premium or restricts coverage based on specific control deficiencies, that pricing signal acts as an external benchmark that validates or challenges internal self-assessments. Organizations that feed underwriting data into their cyber risk benchmarking programs gain a financial lens that complements technical metrics and strengthens board-level reporting with market-calibrated loss data.


As experts in cybersecurity insights and AI threat analysis, the Adaptive Security Team is sharing its expertise with organizations.
Contents